Inspect actual browser requests
Find mixed content and preserve evidence
A lock icon alone is insufficient. Check Console and Network after a cache-free load, exercise interactive features and record the page, insecure URL and resource type.
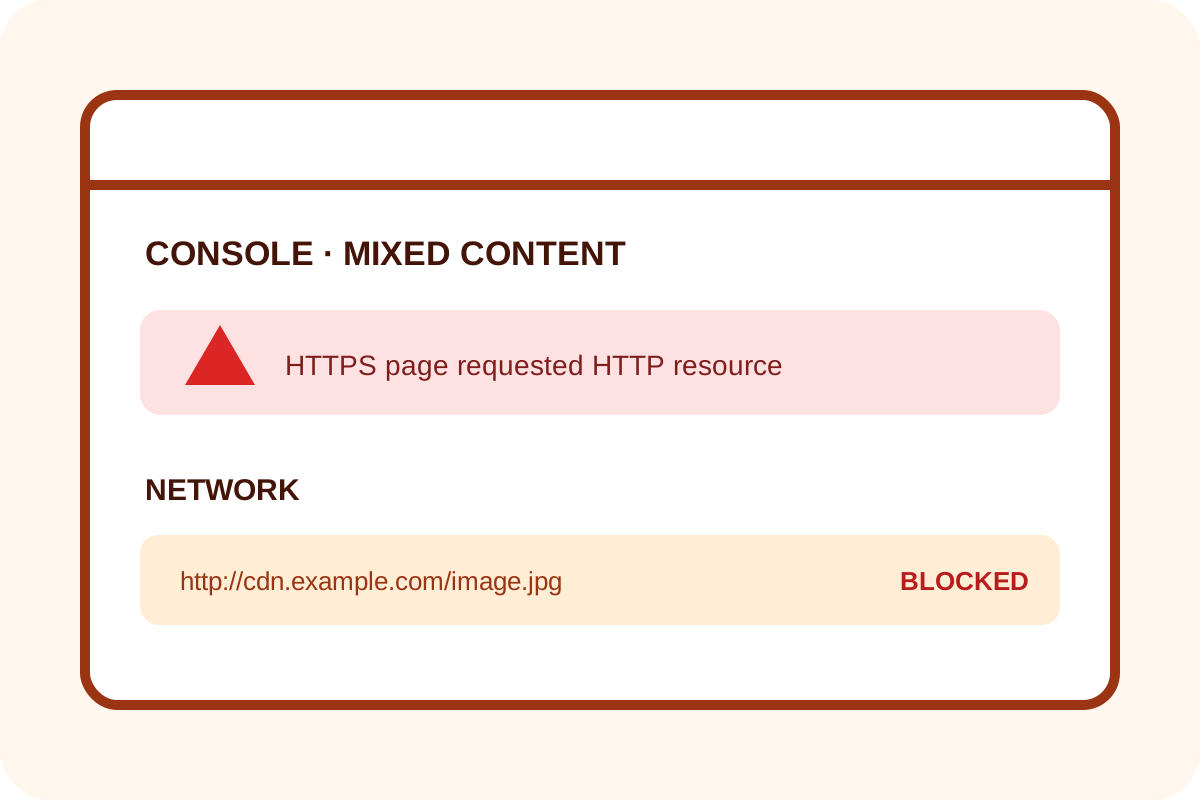
Simple browser check
- Open the exact HTTPS URL in a private window.
- Open DevTools → Console, enable Preserve log and reload without cache.
- Find Mixed Content messages and expand the resource URL.
- Filter Network for
http:, then use menus, forms, video and other dynamic features. - Save the page URL, message screenshot, resource URL and type.
How to classify the issue
| Situation | Level | Action |
|---|---|---|
| No HTTP requests or warnings after all actions | No issue | Save tested URLs and date. |
| An optional image is automatically upgraded | Minor, repair | Make the safe source explicit. |
| A script, style, frame or API request is blocked | Critical | Repair and test the feature. |
| HTTP appears only after a click or consent | Hidden issue | Test the dynamic scenario. |
Alternative check
curl -sS https://example.com/page \
  | rg -n 'http://|url\(["'"']?http:'
This sees source HTML only. It misses requests created by JavaScript, nested frames or loaded CSS, so the browser remains the primary evidence.
False positives and scope
http:// written in an article, comment or data attribute is not mixed content until the browser requests it. Extensions and proxies can also inject messages, so retest in a clean profile.
Any automated price applies only to the templates and scope on the service page. Follow the step-by-step guide for your own repair.