Methodology: This check follows wSEO methodology 1.1. How the assessment works
Independent measurement
Inspect providers, files, transfer size and main-thread work
Our report shows summary figures. PageSpeed Insights provides the complete file list, and a browser Performance recording independently confirms execution time.
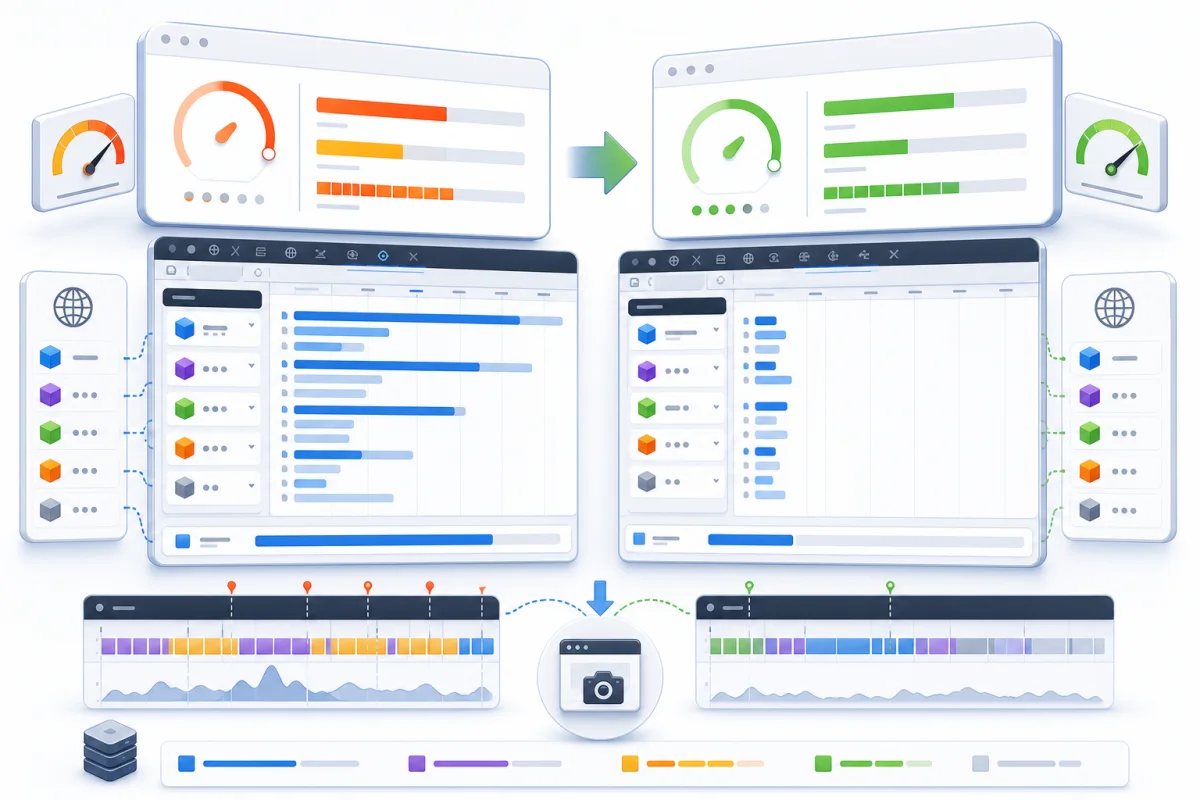
PageSpeed Insights check
- Open PageSpeed Insights and enter the exact URL.
- Run the mobile test and open Performance.
- Find the Third-party code diagnostic or insight.
- Record providers, transferred bytes and main-thread time.
- Expand a provider to inspect its individual files.
- Save the result link and a screenshot.
Assess the result
| Providers | Level | Action |
|---|---|---|
| No measurable impact | Good | No extra work required |
| 1–2 | Yellow | Review load and purpose |
| 3–4 | Medium | Optimize the heaviest providers |
| 5 or more | Critical | Review every integration and dependency |
Confirm with DevTools
- Open a private window → DevTools → Network.
- Enable Disable cache and reload.
- Filter the provider domains and save request count and transfer size.
- Record Performance and find long third-party tasks.
- Repeat with the same URL, viewport and conditions after the change.
Differences and pricing
PSI is a laboratory mobile test, so advertising, geography, cache and external server response can change the figures. Compare several runs under similar conditions and verify functionality manually.
info is the number of unique providers; the total is their file count. The base price covers three integrations on the submitted URL. PSI retains the full list. If confirmed, you can order third-party optimization.